Time to read: 12 min
Oh hey — I caught your attention! Guessing it was the 5-oh-one in the title, up from the 101 you might already be familiar with (self high five for engineer David trying to be a marketer).
Welcome to my article (TED talk?). Here I’m going to walk you through the flow of how to set up tolerance stacks, why you do tolerance stacks in the first place, and most importantly, how you determine you are done with the tolerance stack.
As we go through the examples, I recommend downloading this free tolerance stack calculation workbook, which will enable you to calculate your own tolerance stacks.
Fundamentals Refresh: What is a Tolerance Stack?
You likely did tolerance stack ups in your first Intro to Engineering course homework on a made up assembly that maybe felt kind of pointless because it wasn’t actually an assembly you made and so success = course credit. Now you’re in the real world and a solid tolerance stack can be the difference between success and failure.
The basic concept of tolerance stacks is simple addition and subtraction. With each stack you ask: will the variability I naturally get from part to part in my assembly lead to malfunctions of my design?
This is beyond just: 1) will my parts fit/go together 2) will it perform 3) Can steps (1) and (2) be done repeatedly. When most people talk about tolerance stacks they are likely addressing only one of these steps, but all three is where you need to get to!
For example, you might ask:
- Will the rotating encoder disk be too close to my PCB receiver or too far away?
- Will the square peg fit in the round hole
Let’s dive in with a simple example to start.
Starting with a Simple Example: Linear Rail
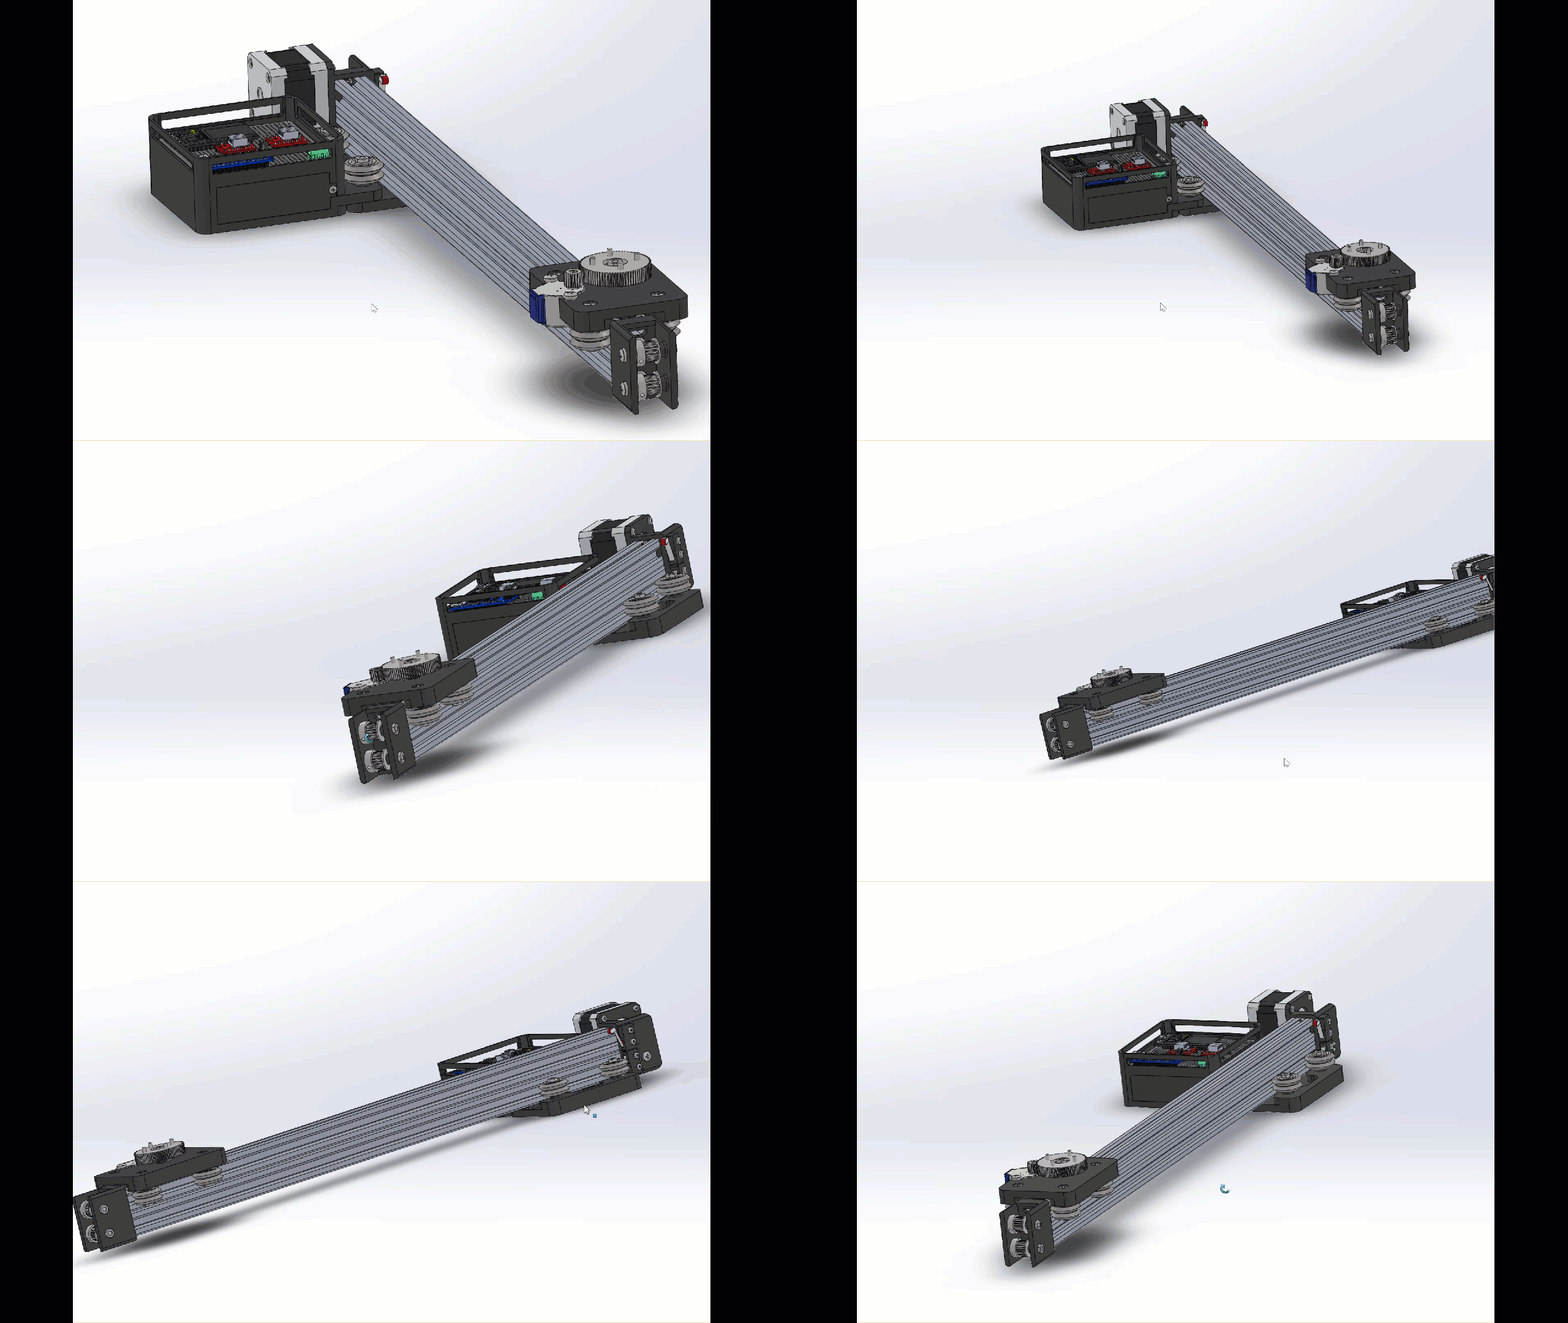
Here’s some example CAD to help us start to break down the tolerance stack process: a linear rail from GrabCad. So let’s pretend we need to do tolerance stacks for this assembly — where do we start (and remember this is more about a process to yield repeatable results for you as a design engineer)?
Break Down the Subsystems
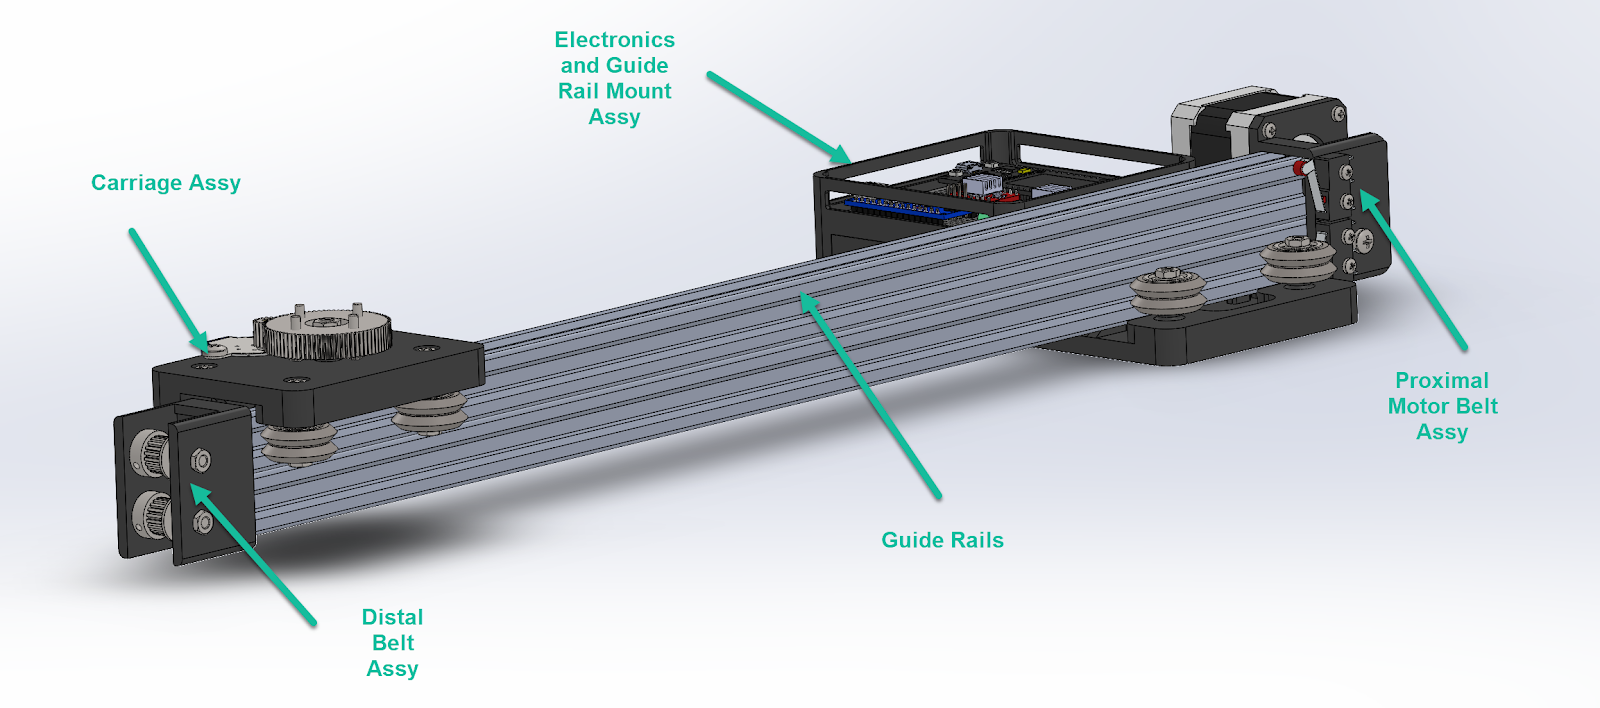
The first thing I like to do with a big problem is to break it down into a series of smaller problems, or subsystems. How do you do this? Sometimes there is a super logical method and some days you just pick something and start. Today, we be doin’ it live folks (Lee-Roy Jenkins!) so let’s just jump in.
In the figure below you can see the subsystems for this linear rail:
Create Interaction Maps
Another method to break things down is to create interaction maps between your subsystems or parts. If you are new to a technology or team this can be a very good place to start, to help ground you in what’s what and guide you to: “noticed this” or “can you explain why this is like this” — all the observations that get you up to speed on the engineering OCD of “why”?
In simpler terms, this is the head, shoulders, knees and toes of tolerance stacks. Ask yourself: what’s connected to what?
Continuing with the example, let’s take the top rail to start (cleverly named, I know).

From this quick breakdown I see at least a few obvious interactions between the top rail and other parts. You can also use the “exploded view” inside Solidworks. And once again, remember you are just trying to get an understanding of what’s going on with the assembly as a starting point.

Once you’ve set up a simple interaction image you want to lay out which interactions need a tolerance stack by looking at each interaction line. There’s a good chance that there is a tolerance stack in the interaction line. Another good reason to use this method is that it will also help you and your quality engineer from doing duplicate work on your DFMEA (Design Failure Modes Effects Analysis).
Let’s start by looking at the chassis (purple image) and the top rail. If you are doing a tolerance stack, you are attempting to mitigate a risk so take credit for it! Risks are mitigated via a hand calculation, a simulation, or a test (sometimes all three of these, depending on risk).
Determine Deeper Interactions
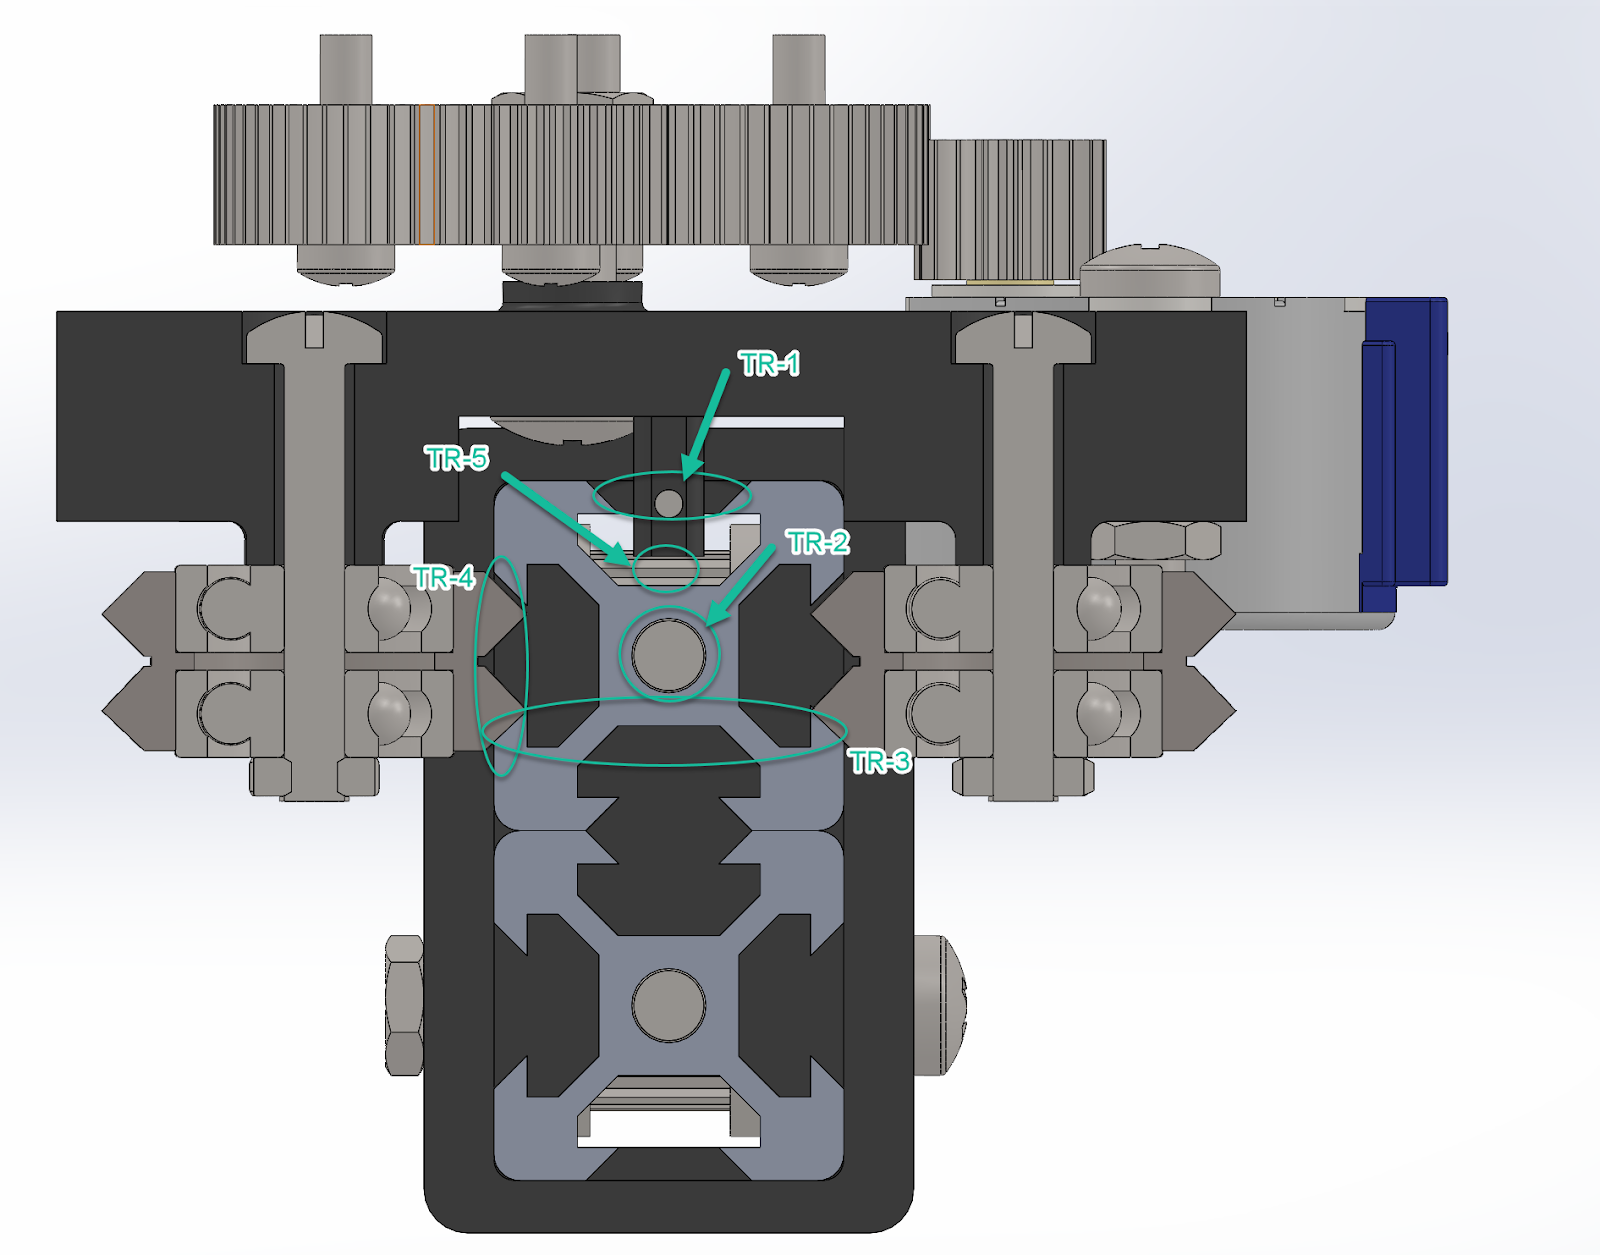
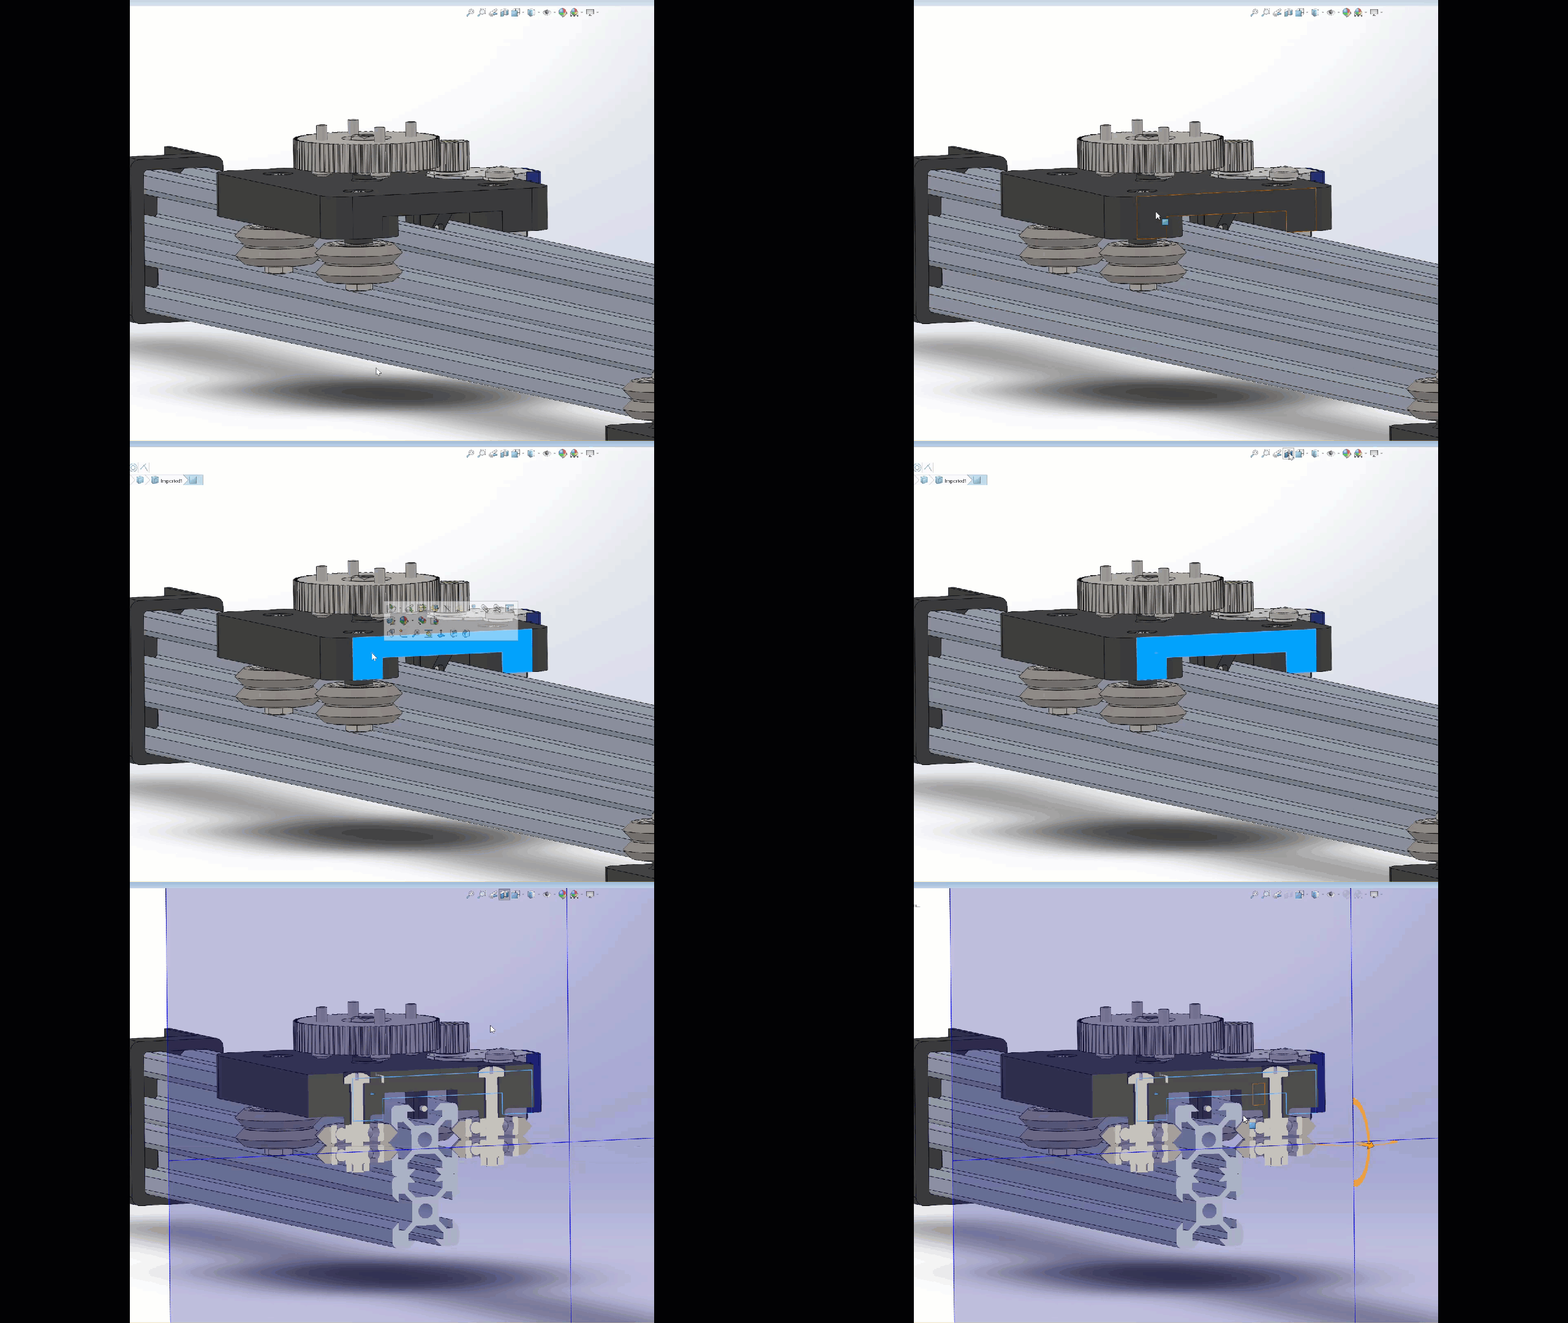
Below I take a cross section for an area of focus and start thinking about what could potentially go wrong or where there are deeper interactions.
Create Your Tolerance Stack Score Card
Next, create a table as the basis of each tolerance stack “score card.” This will ultimately be a big list of tolerance stacks that could result in some type of risk relative to the design—either function or simple assembly.
| Name | Description | Failure(s) | Cpk |
| TR-1 | Top rail groove width to chassis base guide fin width | Fin width too wide — could not fit in TR Groove; causes grinding on rail to chassis base;fin too narrow – n/a | 2 part fit |
| TR-2 | Top rail center thread to screw | Screw won’t fit or wont thread | 2 part fit |
| TR-3 | Top rail wheel bevel surface width to chassis bevel wheel spacing | Too narrow — chassis can fall off track;Too wide — chassis won’t move or won’t move smoothly | TBD |
| TR-4 | Top rail wheel bevel surface width to chassis bevel wheel height | Too narrow — chassis won’t move or won’t move smoothly;Too wide — chassis will sit lower than expected (could cause collisions or fall off track) | TBD |
| TR-5 | Top rail inner center beam surface to bottom of chassis fin clearance | Fin too tall — chassis won’t move or won’t move smoothly;Fin too short — n/a | TBD |
Note: In reality, the top rails and chassis in this example are all off-the-shelf components, so the need to do this would be moot for a CpK analysis. Just treat this as an example!
In the above table you might have seen “CpK” and thought “what dat?” then keeping reading!
What is a Cpk?
Cpk is a statistical measurement that tells you how capable a given process is. You can get into the nitty gritty formulas here on ISIXSIGMA. Whereas a Cpk gives you information about what the process is capable of doing in the future (assuming it remains in a state of statistical control), a Ppk tells you how the process has performed in the past. The reason you can’t use Ppk as a predictive measure is because the process is not in a state of control; Cpk and Ppk values will converge to be almost the same when the process is in statistical control because sigma and the sample standard deviation will be identical (F-test).
Here’s a further breakdown of the difference between Cpk and Ppk:
Cpk:
- Accounts only for the variation within subgroups
- Does not account for any shift and drift between subgroups
- Is sometimes called the “potential capability” because it reflects the potential of a process to produce parts within spec (assuming there is no variation between subgroups over time)
Ppk:
- Accounts for the overall variability between all measurements taken
- Theoretically includes both the variation within subgroups and also the shift and drift between them
- Is where you are at the end of the proverbial day
Putting Cpk into Practice: Garage Example
So let’s put these definitions into practice to understand it further.
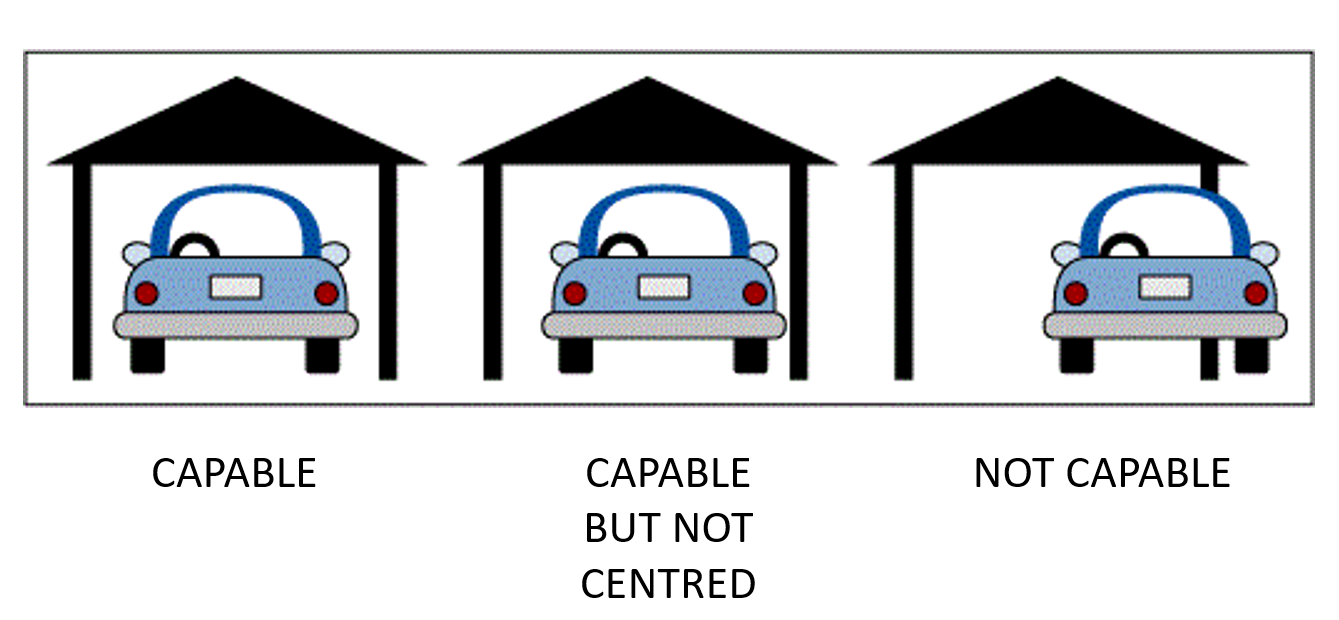
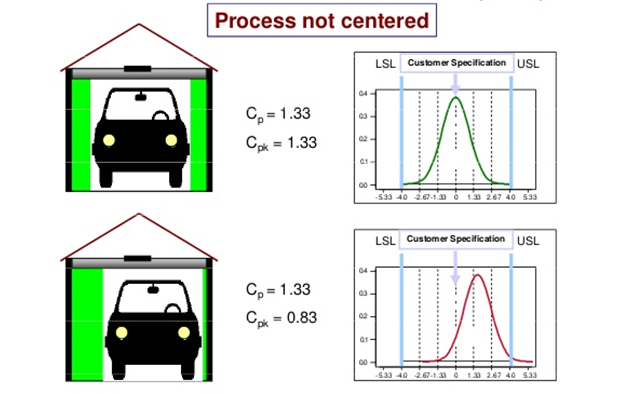
In this example, the garage defines the specification limits and the car defines the output of the process. If the car is only a little bit smaller than the garage, you had better park it right in the middle of the garage (center of the specification) if you want to get all of the car in the garage.
If the car is wider than the garage, it does not matter if you have it centered; it will not fit (Cpk lower than 1).
If the car is a lot smaller than the garage (Six Sigma process), it doesn’t matter if you park it exactly in the middle; it will fit and you have plenty of room on either side.
If you have a process that is in control and with little variation, you should be able to park the car easily within the garage and thus meet requirements.
Cpk tells you the relationship between the size of the car, the size of the garage and how far away from the middle of the garage you parked the car. The value itself can be thought of as the amount the process (car) can widen before hitting the nearest spec limit (garage door edge).
- Cpk = 1/2 means you’ve crunched nearest the door edge and those mirrors are gone (ouch!)
- Cpk = 1 means you’re just touching the nearest edge (the mirror)
- Cpk = 2 means your width can grow 2 times before touching
- Cpk = 3 means your width can grow 3 times before touching
So Why Do We Do This Anyways?
Ok, now that I’ve explained what Cpk is and how it helps predict the stability of your design, the next level thought process is… why? You are doing the tolerance stack—great—but why are you doing it in the first place?
It’s because you’re likely concerned about something, that is a risk, in engineering terms. One of the first steps is to describe your risk and/or failure mode. What can go wrong with your design? For example:
- Can a finger get pinched (minor/moderate risk)?
- Can a finger get severed (serious risk)?
- Does it have small pieces that can cause choking/death of a child (critical risk)?
- Can it cause an entire airplane to go down causing mass casualties (a catastrophic event)?
All of these levels and definitions can vary company to company and by industry. The next step is to determine how likely this risk is to happen.
And news flash: on the first step of this you are just making an educated guess as the engineer. In bigger organizations there is an entire team dedicated to investigate risk levels. But your job as the engineer is to always reduce risk (protect the user, protect the business, protect the product). These things can also be non-safety related too. They can include basic functioning, customer satisfaction, intuitiveness and more.
As an example, if cars or guns were held to the same standard as medical devices, they would be recalled noting improper usage or inability for a user to control the intended usage of the product to get the desired result of the design.
Relating Risk Zones to Desirable Cpk Results
My next two tables relate “risk zones” to your desirable Cpk results.
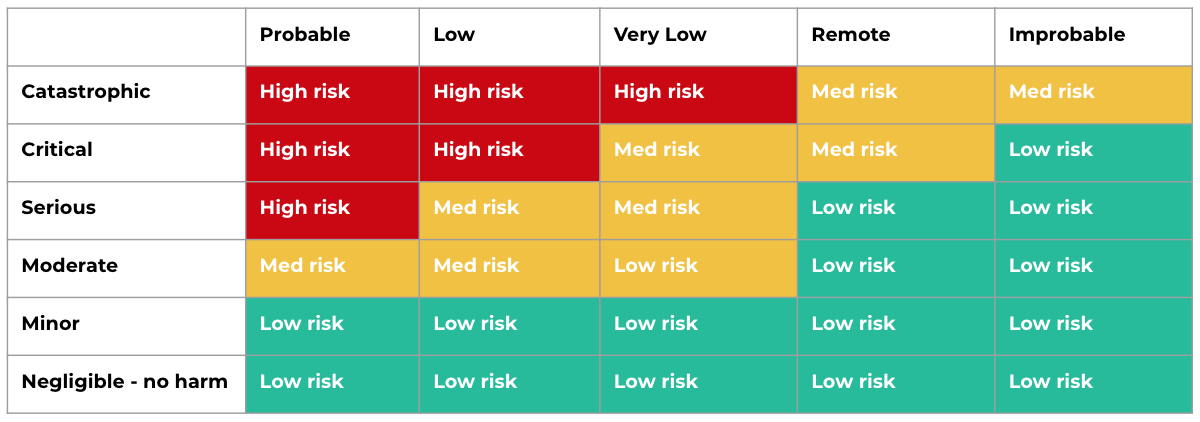
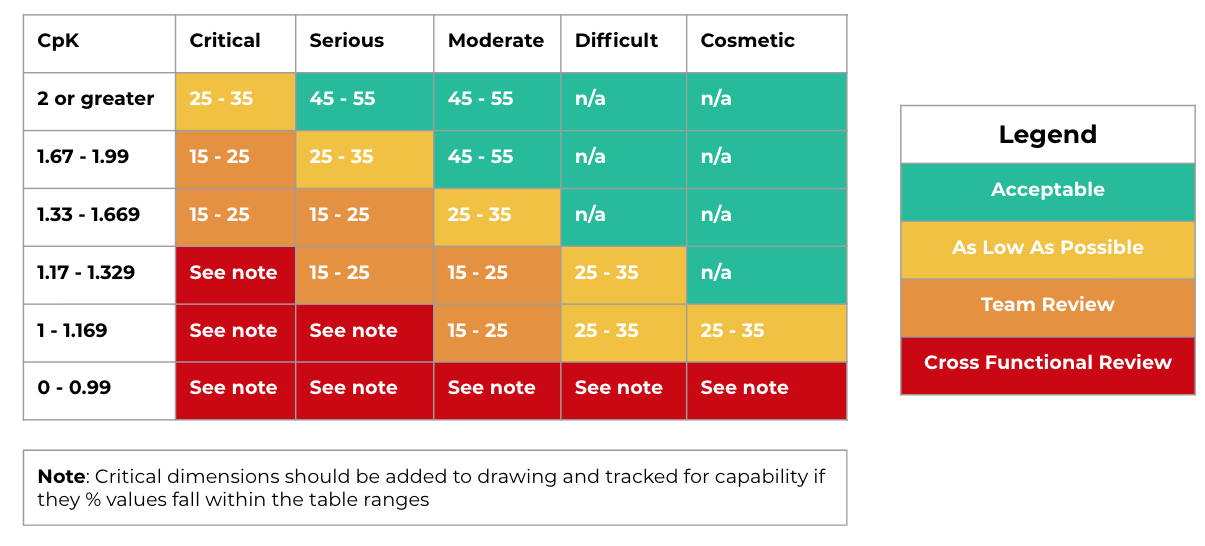
Looking at these two charts, you can see how Cpk relates to the probability of a risk happening!
(okay, pause here to look at the charts, reread portions, let it sink in…)
If you understand this, pat yourself on the back—you just leveled up!

Root Sum Squared Tolerance Stacks
Mmmk, back to tolerance stacks…
Next we’re going to move into a real world example from a China Manufacturing parts, Inc. customer that needed a tolerance stack to determine root cause for a fit issue.
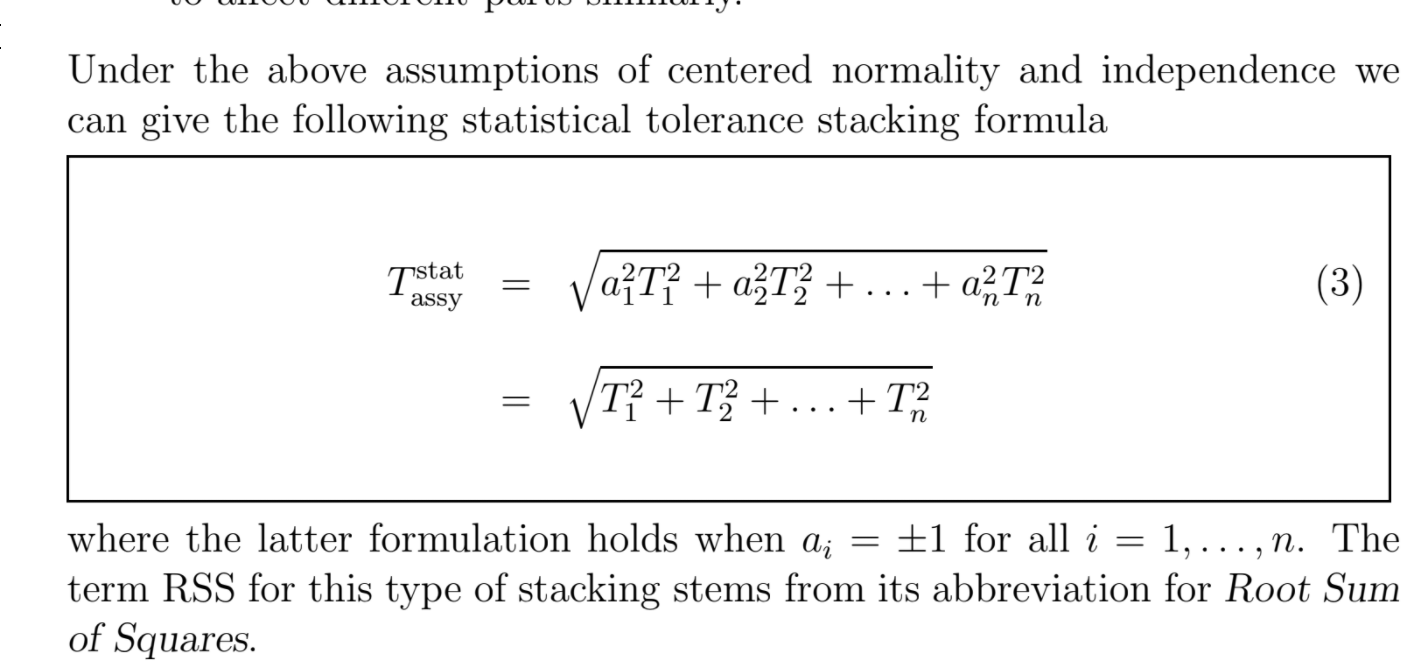
In the example, we’re going to talk about RSS (Root Sum Squared) tolerance stacks, because pretty much every engineer has access to a spreadsheet.
Before we start a couple quick things to keep in mind for RSS stacks:
- RSS formulas most likely use alpha = 1 (this can change; see article)
- Normality is assumed (you need to check this ultimately, because garbage in = garbage out)
- You need at least 3 dimensions or more. RSS does not work for two part fits. (If you must know why, read this paper from University of Washington professor Fritz Scholz and do some math)
For more basic level tolerance stack up information, check out this slide deck from a China Manufacturing parts, Inc. workshop.
Real World Example: Tolerance Stacks for a Portable Bidet Product
Okay, without further ado, this dive into the real world example!
My friend Zach from Sonny has allowed me to share some images from his product that’s moving along in development (check out his indiegogo here).
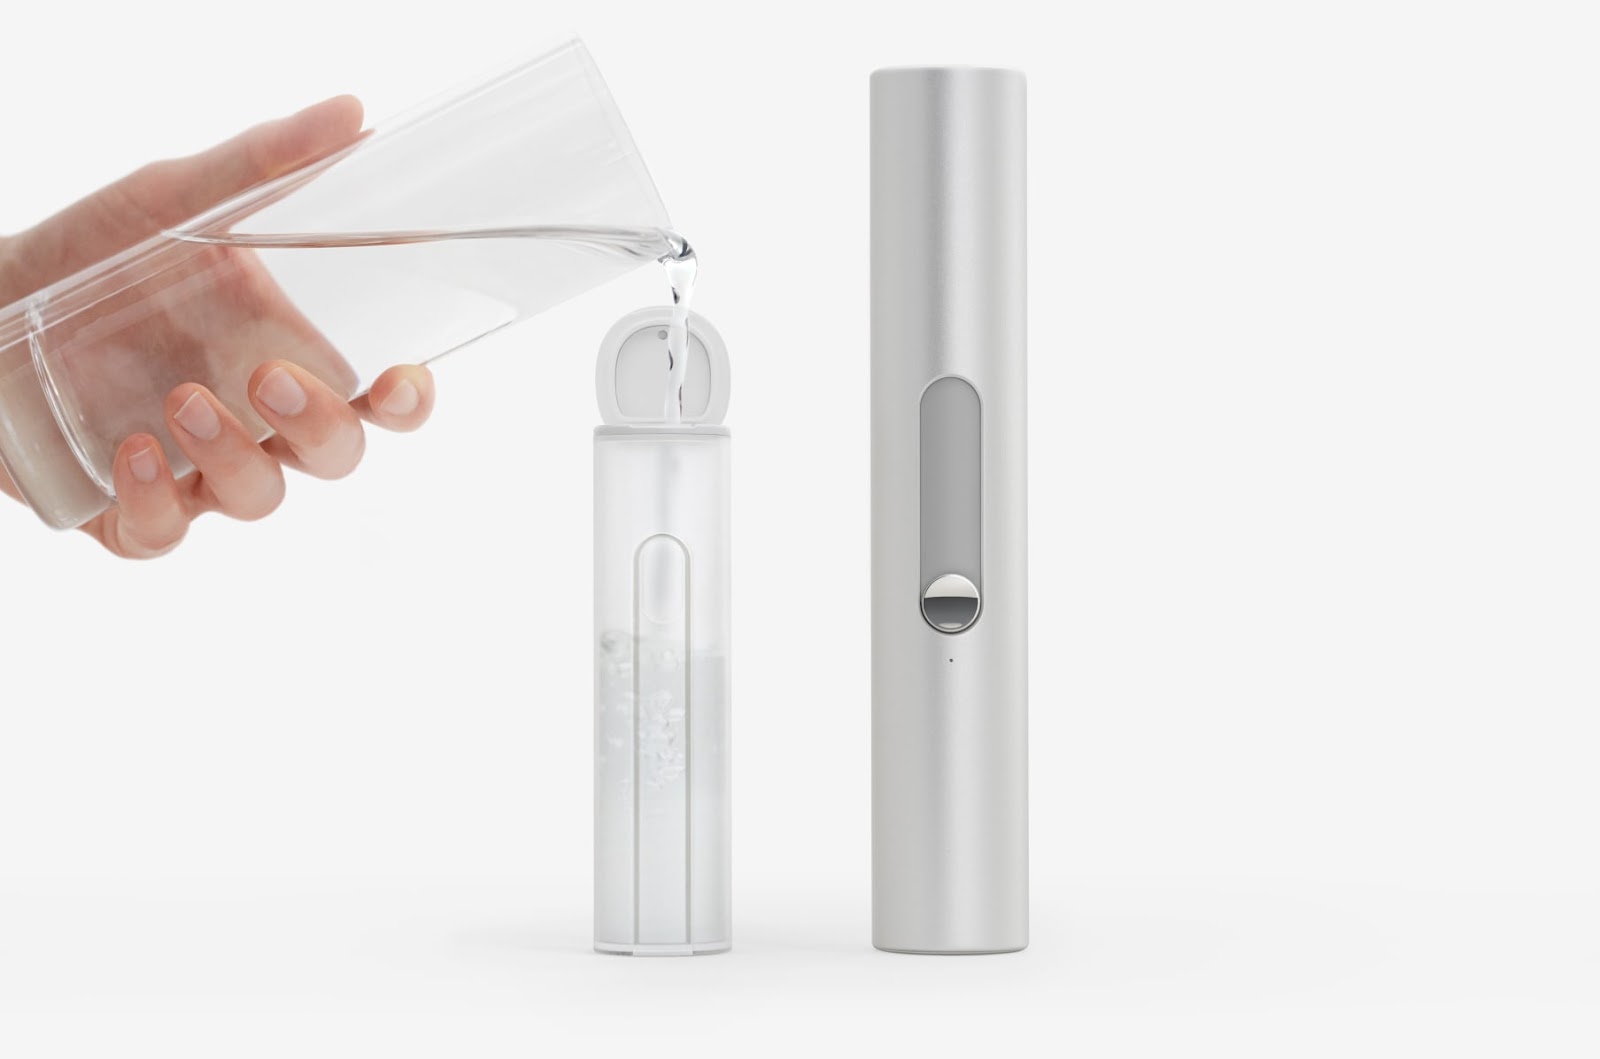
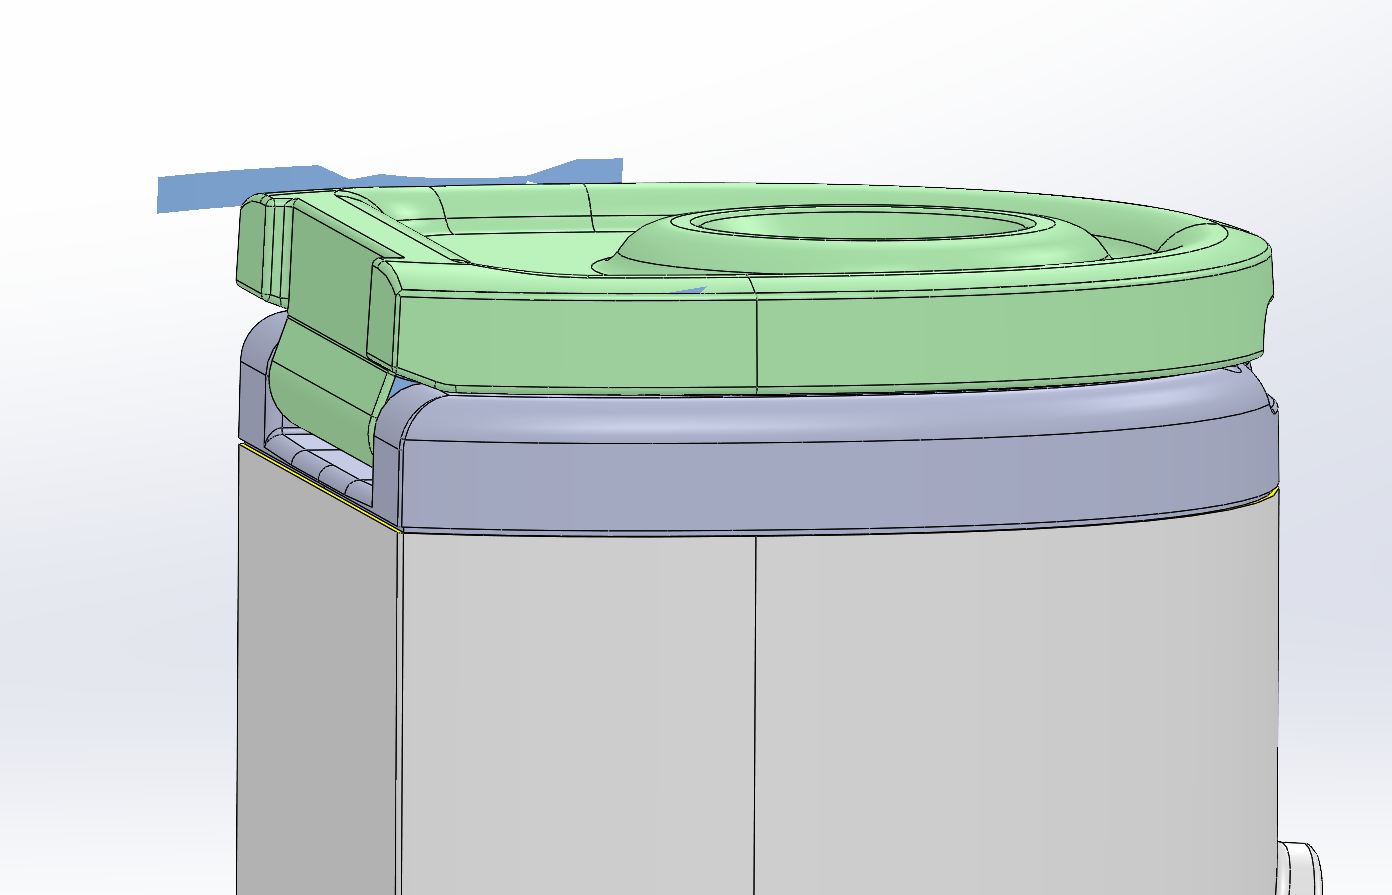
The product has been having difficulty sliding a fluid canister into the device. See GIF and zoomed in image of cap below.
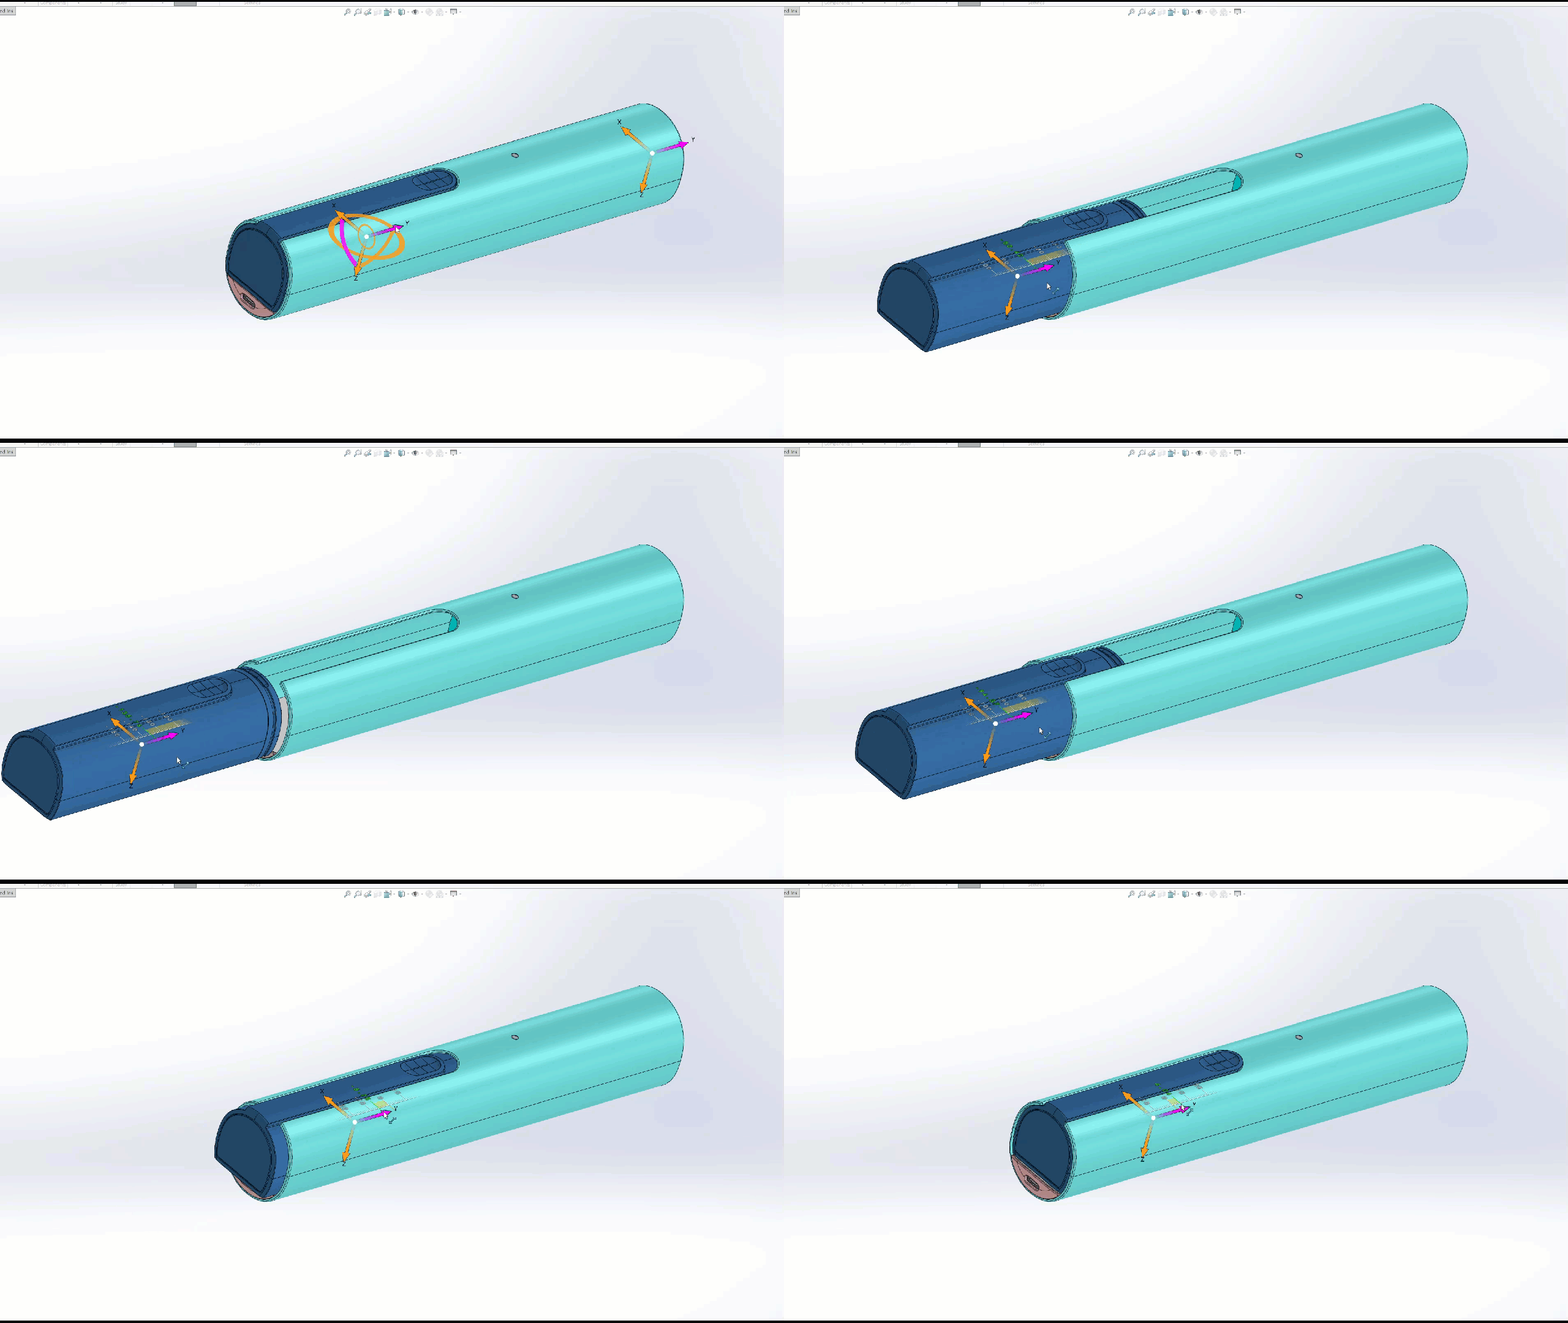
Step one here is to do a tolerance stack as a root cause; the phenomena has been seen that the canister jams/gets stuck or is hard to translate.
So I have an engineering issue that has an occurrence rate of “probable” (as it’s been seen in the first 10 devices) and if this failure were to occur in a sold product or on the production line it makes the device useless. So from a product perspective this is “serious.”
So moving to the Cpk chart (table 2), I go over to the “serious” column. Looking at the different colors, I want to be in the green zone “Acceptable” or yellow zone “As Low as Possible”. If you can’t get into these zones it likely means either a design change or some type of inprocess step handed to the manufacturing team to mitigate/control the risk is needed. That’s why anything in the orange or red zones requires an internal team/managerial review or a cross functional team review to keep everyone informed and find a solution.

These are my steps in summary:
- To fully control risk, I should do a calculation and/or a test with the design as-is, to prove progress forward (or do design change to eliminate the issue; sometimes it’s easier to know my tolerance stack from a “calc” perspective is finished if I can get a 1.33 CpK or better).
- I take a cross section of the canister and show that I don’t want the “green” cap to be able to stick out beyond the sliding surface of the main canister body (shown with my purple arrows).
- I complete the loop by doing the tolerance stack method.
You can download our free tolerance stack calculation workbook here as a template to perform your own tolerance stacks.
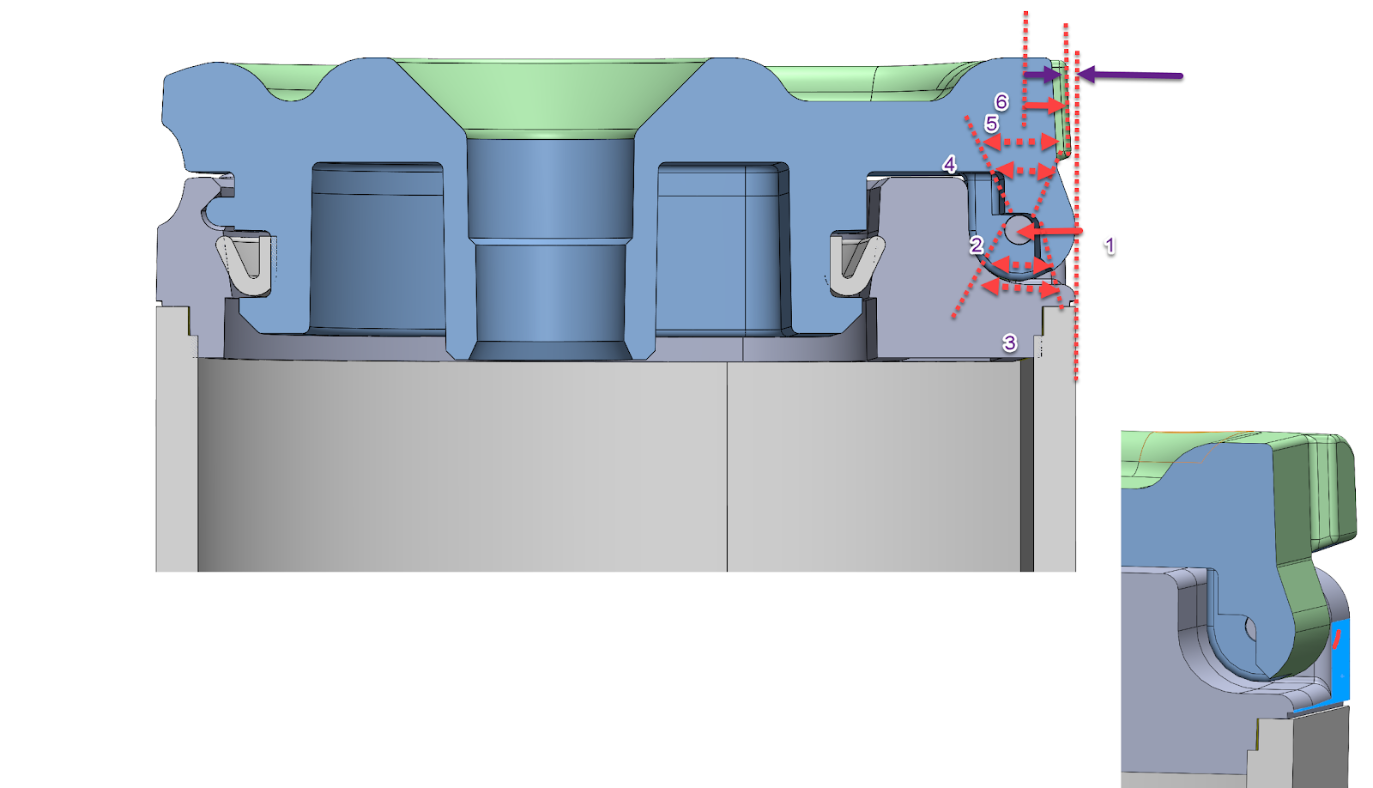


When you do the loops you create your image and you need to remember that you have to pick a direction (in my case for this one, to the left is positive); things that are interference are negative.
In this example, I was taking measures from drawings already created (or CAD if not present) and using the tolerance stacks to review if the drawings had all the applicable information. “Orange“ cells in the table were for me to remember that they weren’t on the drawing—meaning the risk is not being managed. The way to manage the risk would be to add to the drawing. Then the risk is being attempted to be controlled.
In this design you also need to set limits for your Cpk analysis. What’s important to understand when setting the limits is that it is very specific to the direct problem you are trying to solve or the condition you have identified with your arrows. You are looking for a gap and the gap needs to be greater than 0, such that if it were negative the cap would not drag the canister body.
So theoretically if the part was gone, the gap would be infinity but it wouldn’t drag so this is a theoretical solution to the problem. But for this I could have said my USL (upper spec limit) is 5, 1—it doesn’t truly matter as long as it’s greater than 0. So my lower spec limit (LSL) is, well, 0.

From the results we can see that the lower spec limit is being calculated at 1.58. This isn’t quite what I need to retire the risk.
At this point you might be wondering what the numbers inside the chart mean. These are ‘influencers’ and if you were doing a CETOL or vis-vsa analysis, those 3D tolerance stack softwares will tell you by % which dimensions are driving your result. If you use these tools and see something in the box that is equal or greater than 30% in our example, that’s an immediate critical dimension! Once again, your goal is to try to eliminate this issue with engineering drawing controls or a design change.
Here’s the Cpk to Risk Severity chart again for reference:

Now that I’ve finagled and messed with my tolerances, I can see I’m not quite getting the desired result. So how do I figure out what I need to do? I back calculate my equation to determine what I need:

You now know what your nominal clearance needs to be to drive your design to be in the “As Low As Possible” zone. You could repeat this for Cpk of 2 (nominal = 0.3162mm) and if it doesn’t introduce another risk, do it. Eliminate it and avoid the ‘why’d you do that?’ shame bell look from your manufacturing team four months from now.

If you’re a person that needs verbal reinforcement, please join our webinar where we will walk through in detail! And if you need manufacturing for those tight tolerance CNC parts, check out Fictiv.

